Overview
For the second lab, we will be using a dataset containing information collected by the U.S Census Service concerning housing in the area of Boston Mass. The dataset was colelcted by the U.S Census Service concerning housing in the area of Boston Mass, posted in statlib Archive, and has been used extensively throughout in benchmarking algorithms. The dataset itself is small, with only 506 cases recorded.
The data was originally published by Harrison, D. and Rubinfeld, D.L. Hedonic prices and the demand for clean air, J. Environ. Economics & Management, vol.5, 81-102, 1978.
Dataset Attributes
There are 14 variables in this dataset, people often interested in two prototasks: nox, in which the nitrous oxide level is to be predicted; and price (medv), in which the median value of a home is to be predicted.
There are 13 attributes for each house of the dataset. They are:
- crim - per capita crime rate by town
- zn - proportion of residential land zoned for lots over 25,000 sq.ft.
- indus - industry, proportion of non-retail business acres per town.
- chas - Charles River dummy variable (1 if tract bounds river; 0 otherwise)
- nox - nitric oxides concentration (parts per 10 million)
- rm - the average number of rooms among homes in the neighborhood
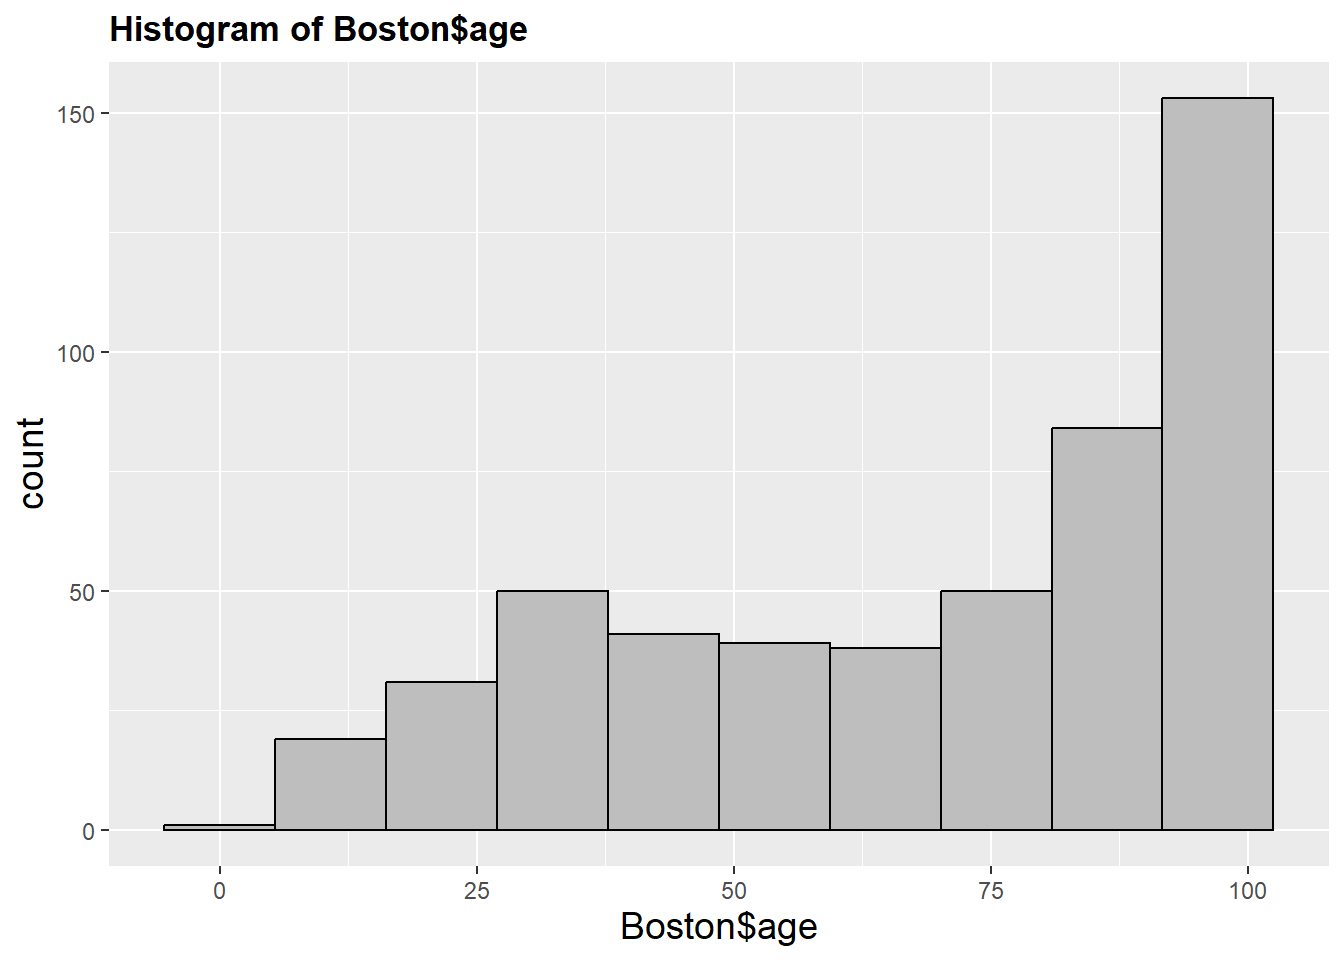
- age - proportion of owner-occupied units built prior to 1940
- dis - weighted distances to five Boston employment centres
- rad - index of accessibility to radial highways
- tax - full-value property-tax rate per $10,000
- ptratio - pupil-teacher ratio by town
- lstat - percentage of population considered lower status (working poor)
- medv - Median value of owner-occupied homes in $1000’s
Kaggle, an online data science community, has done many analyses on this dataset.
Summarizing the dataset in R
Using the str() function, we can list out the variables and their data type in the Boston dataset.
'data.frame':   506 obs. of  13 variables:
 $ crim   : num  0.00632 0.02731 0.02729 0.03237 0.06905 ...
 $ zn     : num  18 0 0 0 0 0 12.5 12.5 12.5 12.5 ...
 $ indus  : num  2.31 7.07 7.07 2.18 2.18 2.18 7.87 7.87 7.87 7.87 ...
 $ chas   : int  0 0 0 0 0 0 0 0 0 0 ...
 $ nox    : num  0.538 0.469 0.469 0.458 0.458 0.458 0.524 0.524 0.524 0.524 ...
 $ rm     : num  6.58 6.42 7.18 7 7.15 ...
 $ age    : num  65.2 78.9 61.1 45.8 54.2 58.7 66.6 96.1 100 85.9 ...
 $ dis    : num  4.09 4.97 4.97 6.06 6.06 ...
 $ rad    : int  1 2 2 3 3 3 5 5 5 5 ...
 $ tax    : num  296 242 242 222 222 222 311 311 311 311 ...
 $ ptratio: num  15.3 17.8 17.8 18.7 18.7 18.7 15.2 15.2 15.2 15.2 ...
 $ lstat  : num  4.98 9.14 4.03 2.94 5.33 ...
 $ medv   : num  24 21.6 34.7 33.4 36.2 28.7 22.9 27.1 16.5 18.9 ...
The ISLR2 library contains the Boston data set, which records medv (the median house value) for 506 census tracts in Boston. We will seek to predict medv using 12 predictors such as rmvar (average number of rooms per house), age (average age of houses), and lstat (percentage of households with low socioeconomic status).
| 0.00632 |
18 |
2.31 |
0 |
0.538 |
6.575 |
65.2 |
4.0900 |
1 |
296 |
15.3 |
4.98 |
24.0 |
| 0.02731 |
0 |
7.07 |
0 |
0.469 |
6.421 |
78.9 |
4.9671 |
2 |
242 |
17.8 |
9.14 |
21.6 |
| 0.02729 |
0 |
7.07 |
0 |
0.469 |
7.185 |
61.1 |
4.9671 |
2 |
242 |
17.8 |
4.03 |
34.7 |
| 0.03237 |
0 |
2.18 |
0 |
0.458 |
6.998 |
45.8 |
6.0622 |
3 |
222 |
18.7 |
2.94 |
33.4 |
| 0.06905 |
0 |
2.18 |
0 |
0.458 |
7.147 |
54.2 |
6.0622 |
3 |
222 |
18.7 |
5.33 |
36.2 |
| 0.02985 |
0 |
2.18 |
0 |
0.458 |
6.430 |
58.7 |
6.0622 |
3 |
222 |
18.7 |
5.21 |
28.7 |